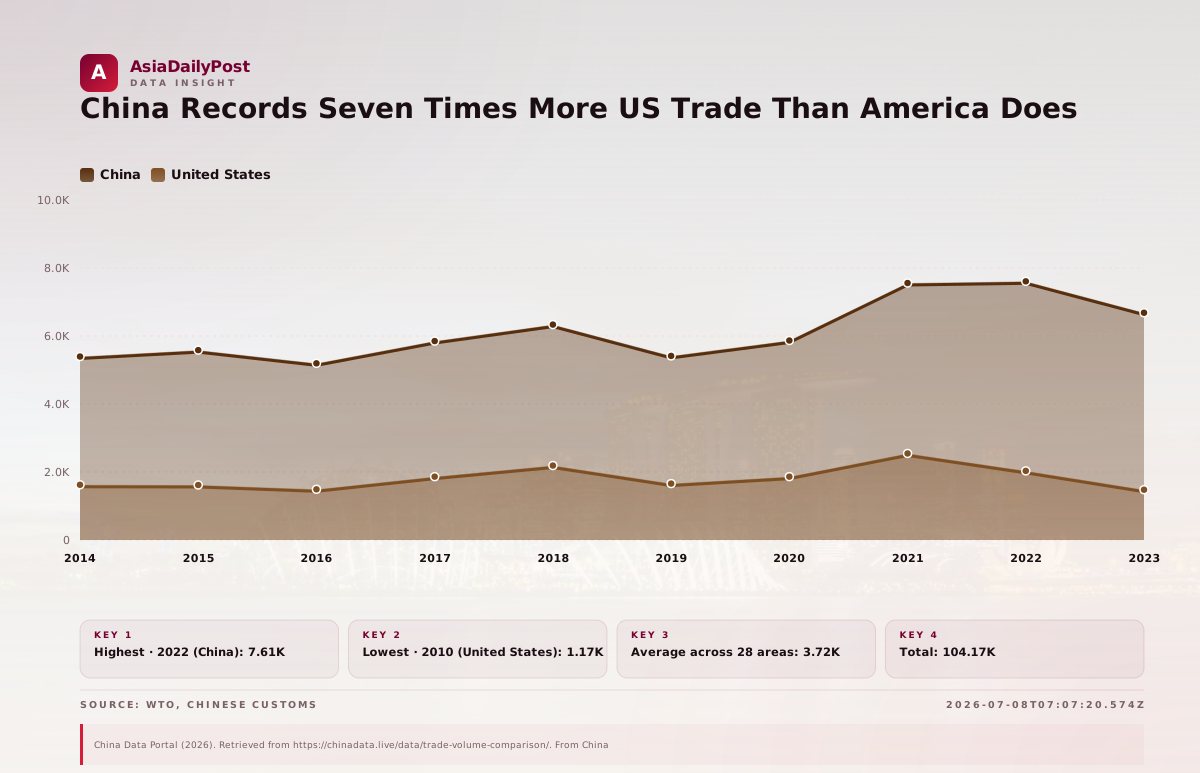
China's bilateral trade with the United States surged to an all-time high of $7,608 billion in 2022, while the American side’s lowest recorded figure — $1,166 billion in 2010 — barely registered on the same scale. The dataset, spanning 2010 to 2023, tracks each side's reported trade volume with the other, revealing a chasm that has only widened.
Top of the chart: China's outsized numbers
China’s bilateral trade volume dwarfed the U.S. in every year of the series. The peak of $7,608 billion in 2022 marked the apex of a decade-long climb, though it slipped to $6,684 billion in 2023. Even China’s lowest annual reading in this stretch — $3,831 billion in 2010 — was more than three times the U.S. tally that same year.
The other end: a much smaller American count
The U.S. figure never exceeded $2,545 billion, a high-water mark reached in 2021. By 2023, that number had retreated to $1,479 billion, below its 2010 starting point. In every year, the U.S. reported trade volumes that were merely a fraction — sometimes less than a fifth — of China’s corresponding entry.
What separates the two
The divergence between the two series hardly budges. Whether the spread reflects differences in customs accounting, valuation methods, or the inclusion of re-exports via Hong Kong, the data makes clear that China and the U.S. measure their economic entanglement with completely different yardsticks.
- China 2022: $7,608 billion
- China 2021: $7,558 billion
- China 2023: $6,684 billion
- China 2018: $6,335 billion
- China 2020: $5,867 billion
- China 2017: $5,851 billion
- China 2019: $5,414 billion
The gap has been a fixture for more than a decade, and in 2023 the ratio still stood above four-to-one. As trade tensions reshape supply chains, that measurement mismatch will only grow harder to ignore.
Source: WTO, Chinese Customs · 2026-07-08T07:07:20.574Z